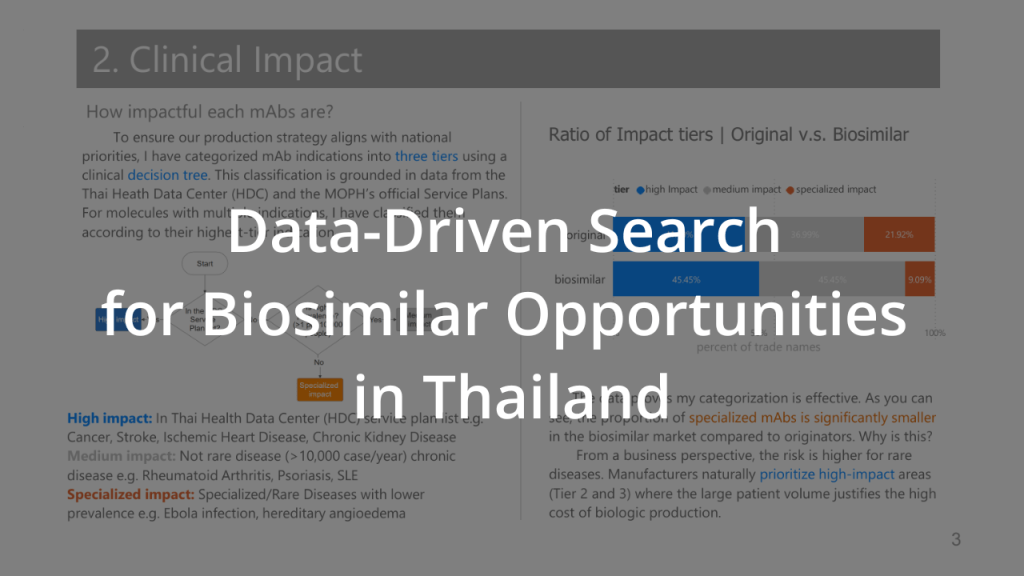
• Personal project: A Data-Driven Search for Biosimilar Opportunities in Thailand

    This project is a labor of passion: a fusion of my clinical background as a pharmacist and my growing passion for data analysis.

    My goal was simple: to use data to identify which crucial Monoclonal Antibodies (mAbs) are missing from the Thai market despite being available as affordable biosimilars in the US.

    I’ve combined storytelling and data visualization to summarize this journey. Each page represent a core step in the analytical process, moving from raw data to actionable clinical insights. I hope you find this process as fascinating as I did!

    How I made this?

    Inspiration

    As a pharmacist in Thailand, I see the innovation lag firsthand. Advanced biologic therapies (mAbs) are transforming medicine, but their high costs often keep them them out of reach for most Thai patients. While, In the US, Biosimilars, a safe, interchangeable , affordable versions of these drug launch as soon as patents expire.

    I wanted to find the answer: Which critical molecules are we missing in Thailand that are already available in the US?

    Methodology: Data analysis

    1. Data preparation

    1.1 Prepare US mAbs data from Purple Book

    I started with the US FDA Purple Book. I prefer using the data transformation pane in Power BI for initial exploration. The automatic column profiles and quality distributions give me an instant glimpse of the data.

    I cleaned the generic name (Proper Names) by stripping manufacturer suffixes (e.g., changing “Adalimumab-atto” to “Adalimumab”) to create a clean list for cross-referencing.

    A part of the head of data:

    the table schema:

    1.2 Prepare Thai mAbs data from Thai FDA scraping

    While the US data was a simple CSV, the Thai data was a different story. Since no public dataset existed, I built a Scrapy crawler in Python to navigate the Thai FDA search portal and build a mirrored dataset.

    • I used Google Colab and Pandas to manage my search list, then deployed the Scrapy crawler to capture product names, license holders, and registration statuses.
    • I used Power BI to join these two datasets. This allowed me to identify “mismatches” which are mAbs registered in the US but absent in Thailand.

    My codes for scraping are:

    %%writefile med_spider.py
    import scrapy
    
    class MedSpider(scrapy.Spider):
        name = "meds"
        # 1. Added a User-Agent
        custom_settings = {
            'USER_AGENT': 'Mozilla/5.0 (Windows NT 10.0; Win64; x64) Chrome/119.0.0.0 Safari/537.36',
            'COOKIES_ENABLED': True, # ASP.NET sites NEED cookies to track your session
            'DOWNLOAD_DELAY': 5,        # Wait 5 seconds between drugs
            'CONCURRENT_REQUESTS': 1,   # One at a time to stay under the radar
            'USER_AGENT': 'Mozilla/5.0 (Windows NT 10.0; Win64; x64) Chrome/119.0.0.0 Safari/537.36',
            'FEEDS': {
                'med_results.csv': {
                    'format': 'csv',
                    'encoding': 'utf-8-sig',
                    'overwrite': True,
                }
            }
        }
        
        start_urls = ['Thai FDA drug searching URL']
        usmed_list = [list of mAb generic names from Purple Book]
    
        # 1. This replaces the default start_urls behavior
        def start_requests(self):
            for drug in self.usmed_list:
    
                # visit the landing page once for each drug to get a fresh ViewState
                yield scrapy.Request(
                    url=self.start_urls[0],
                    callback=self.parse,
                    meta={'search_term': drug}, # save the drug name
                    dont_filter=True # for hitting the same URL multiple times
                )
    
        def parse(self, response):
    
            # retrieve the drug name saved in meta
            drug_to_search = response.meta['search_term']
    
            # from_response: handle the hidden ASP.NET ViewState
            return scrapy.FormRequest.from_response(
                response,
                formdata={
                    'ctl00$ContentPlaceHolder1$txt_substance': drug_to_search,
                    'ctl00$ContentPlaceHolder1$btn_sea_drug': 'ค้นหา'
                },
                callback=self.parse_results,
                meta={'search_term': drug_to_search} # Pass it forward again to the results
            )  
    
        def parse_results(self, response, ):
            search_term = response.meta['search_term']
            rows = response.css('tr.rgRow, tr.rgAltRow')
    
            self.logger.info(f"Found {len(rows)} rows on the page!") # show logs
    
            for row in rows:
                # gets text inside <span> or <a> tags.
                data = row.css('td:not([style]) ::text').getall()
    
                # Clean up the list (keep empty strings)
                clean_data = [item.strip() if item else "" for item in data]
    
                if len(clean_data) > 0:
    
                    yield {
                        'searched_drug': search_term,
                        'registration_no': clean_data[1] if len(clean_data) > 0 else None,
                        'trade_name': clean_data[3] if len(clean_data) > 3 else None,
                        'licensee': clean_data[4] if len(clean_data) > 4 else None,
                        'drug_type': clean_data[5] if len(clean_data) > 5 else None,
                        'status': clean_data[7] if len(clean_data) > 5 else None
                    }
                    
    !scrapy runspider med_spider.py
    

    1.3 Identifying hidden gaps

    Initial results showed that most of absent drugs were orphan drugs or for rare diseases. To find the “real” opportunities, I needed more information. These are what I started with:

    • Market Demand: Top 20 Global Sales data (via Pharmashots) to identify clinical demand and physician trust worldwide.
    • Prevalence data: Which disease are crucial in Thailand?
      • HDC website shows prevalence data of crucial diseases with ICD-10 code related to those diseases (2025).
      • It also show diseases in “Service plan” which are the group of diseases that intensively monitored by Thailand’s Ministry of Public Health (MOPH).
      • WHO Top cause of death of Thai population (2021).
    • Reimbursement Barriers: National List of Essential Medicines (NLEM) is the “optimum list” of fundamental treatments. It serves as the official reference for reimbursement across public health insurance scheme. there are 7 mAbs in this list.
    • Biosimilar gap: I used “BLA type” column, a original/biosimilar label from Purple Book to evaluate a status of Thai mAbs list.

    2. Modeling

    Building this database was an iterative process. This dataset is not perfect. It’s grew organically as I added data one-by-one, but it taught me lessons for my next project:

    1. Whenever possible, collect all data before designing the schema.
    2. Establishing strict naming rules early to prevent inconsistent naming.
    3. Moving toward a star schema and database normalization makes the system much more robust as data piles up.

    3. Visualization

    3.1 Top 20 Monoclonal Antibodies by Global Sales

    I discovered that the Top 20 mAbs account for 60% of total global mAb sales. This is a massive concentration of value!

    By highlighting which of these 20 have zero biosimilar competition in Thailand, I identified the most significant market gaps.

    3.2 Clinical Impact

    Prevalence data can be “noisy”. Disease are grouped to a big categories like “heart disease” consisting of many ICM-10 codes which make the prevalence illogically high. So, I came up with the decision tree for categorizing each mAbs in to three tiers, inspired by inclusion criteria of the NELM. Categorization was derived from the MOPH 2025 National Health Priorities and the HITAP Burden of Disease framework(Issue 26).

    • Tier 3 (High): Aligned with the Thai MOPH “Service Plan” (e.g., Cancer, Stroke).
    • Tier 2 (Medium): Prevalence is higher that rare disease threshold (>10,000 case/year).
    • Tier 1 (Specialized): The leftovers: Rare or specialized indications.

    3.3 NLEM gap

    I created bar chart showing count of each mAbs in NLEM list biosimilars in Thailand. The data show 2 mAbs don’t have biosimilar yet, which is a huge market gap.

    3.4 Biosimilar availability gap

    I compared the number of US biosimilars (Blue for positivity/opportunity) against Thai biosimilars (Orange for competition/saturation). This visual logic allowed me to assign scores for my final index.

    Visualizations helps me create scoring:

    VariableScored Value
    1. World Top 20 Revenue2 pts if yes 0 pts if No
    2. High-Impact Disease3 pts if High impact
    2 pts if Medium impact
    1 pt if Specialized impact
    3. NLEM Status2 pts if NO
    0 pts if YES
    4. Biosimilar Gap3 pts if US Yes; TH No
    2 pts if US Yes; 1-2 biosimilar TH
    1 pt if US No; TH No
               or 3 TH 0 pts else

    Formulation for evaluate potential of mAbs:

    TMOI = Rev + Tier + NLEM Gap + Biosimilar gap

    4. Analyzing

    I synthesized all variables into a 10-point scale: the TMOI. Our mAbs for potential market entry and production feasibility are:

    1. Tocilizumab (9 pts)
    2. Omalizumab (7 pts)
    3. Pertuzumab (7 pts)
      After identified potential molecules, I would recommend the team to prioritize these three molecules for comprehensive feasibility and production studies.

    Claims & Cautions

    • Global revenue data is from private industry reports and should be treated as an estimate.
    • This impact tiering is a simplified version of NLEM criteria. In a real-world scenario, Cost-Effectiveness and HTA (Health Technology Assessment) would require much deeper modeling.
    • Many mAb manufacturers located outside the US are not included in this project.

    Project Technical Stack (Hi, recruiters!)

    To bring this analysis to life, I utilized a mix of clinical domain knowledge and technical tools:

    • Data acquisition: Python (Scrapy) for web scraping Thai FDA data.
    • Data engineering: Power Query and Excel for cleaning and joining international datasets.
    • Data modeling: Relational database design in Power BI.
    • Analytics & Visualization: DAX for scoring logic and Power BI for storytelling.
    • Clinical Frameworks: NLEM criteria, and Thai Health Data Center (HDC) data.
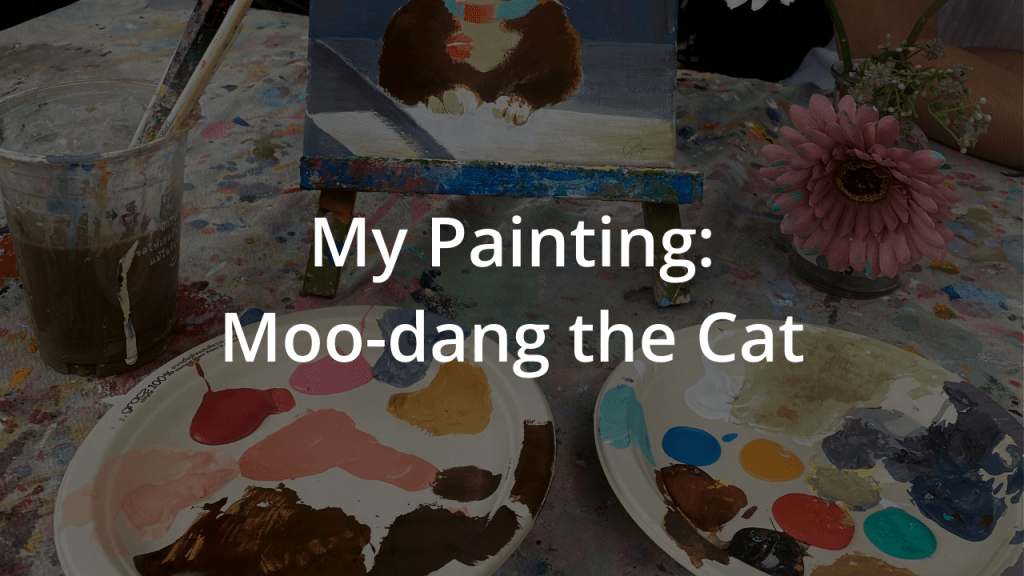
  • My Painting: Moo-dang the Cat

    I love art in general, and painting is one of the hobbies I use to express my passion for it.

    I feel a strong resonance with dramatic natural lighting. Thereis a style named “Chiaroscuro” (Italian for “light-dark”) that focus on this. One of my hobbies is capturing “chiarocuro” moments from the internet or in real life by taking photos, which will be used in this painting.

    My style is inspired by many artist and photographer, but the main inspiration of this painting is: Yuming Li

    The model for today

    Moo-dang (translate to “Red pork” which is a Thai dish) is the model for today. She is the most well-behaved and lovely cat of all; her only flaw is being too clingy (how cute?). I saw her lying on top of the refridgerator and love the play of light and shadow, so I captured the moment with my iPhone.

    The painting process

    Even though I had never taked a painting lesson and didn’t even know which specific colors I was using (because I painted in a café that provided the supplies). I still have the courage to show you how I did it!

    1. Sketching: I skecthed her with a pencil, I don’t really have a technique on proportion (and it shows), but I do have a techique for deciding on light shadow area. I imagine the picture is in black and white, and focus the light and dark values. Then, I draw lines to separate them and mark the dark area with crosses.
    2. Adding values: I painted with basic colors to block out where it’s light or dark. When you hesitate, just choose a lighter color!
    3. Adding depth: I went further with the values. Where there was brown, I applied dark brown. Where there was the beige, I applied yellow or ivory. This was also a time to apply bold colors like red and teal.
    4. Finishing details: I touched it up with white where the light hits and finish small details like the eyes and whiskers.

    What I learned

    Surprisingly, painting taught me to create a system and stick with it. What comes to your mind if you only stare at the second step? Well, I thought it was ugly, haha! But I had faith in the process. Just blow the worries out of your mind and trust the system. Keep the details for later, and Voilá! you got a cute, dramatic kitty!

    My aim isn’t perfection. It’s just to finish it and show it to the world. Feedback from others is often better than being wrapped up in your own vision. For example, I showed this to my mom, and she instantly commented: “Her eyes are too big, and her nose is too small”. I totally agreed, but I hadn’t noticed because I too busy worrying about themessed up whiskers!

    I realized it is better to finish something and receive feedback than try to be perfect and keep it hidden away in your bedroom.

    Look at her! She just look like she smells good.
  • Project: Rock Paper Scissors game

    This is a Rock Paper Scissors game I built in R! This project was actually an exercise from a data analysis course I enrolled. It was a fun way to practice the logic of coding

    How to play

    To play this game, you will need to run the code in an R environment. You can use any platform you are comfortable with, e.g. Posit Cloud, Google Colab, or RStudio Desktop.

    Follow these steps

    1. Copy the code below, or from GitHub.
    2. Paste and run the script in your R console.
    3. Start the game by typing play_rps() and hitting Enter.
    4. Follow the on-screen instructions to make your move.
    play_rps <- function() {
      hands <- c("rock", "paper", "scissors")
      player_score <- 0
      valid_choices <- c(hands, "exit")
      while(TRUE) {
        player_choice <- tolower(readline("Choose your hand(rock, paper, scissors) or exit: "))
        
        # Check for invalid inputs 
        if (!(player_choice %in% valid_choices)) {
          print("Invalid choice. Please enter 'rock', 'paper', 'scissors', or 'exit'.")
          next # Skips the rest of the loop and starts the next iteration
        }
        
        if (player_choice == "exit") {
          cat("\n--- GAME OVER ---\n")
          print(paste("Total score: ",player_score))
          break
        }
        com_choice <- sample(hands, 1)
        print(paste("Computer chose:", com_choice))
        
        if((player_choice == "rock" & com_choice == "scissors")|
                (player_choice == "paper" & com_choice == "rock")|
                (player_choice == "scissors" & com_choice == "paper")) {
          player_score <- player_score+1
          cat("you win this round!")
        }
        else if((player_choice == "rock" & com_choice == "paper")|
                (player_choice == "paper" & com_choice == "scissors")|
                (player_choice == "scissors" & com_choice == "rock")) {
          cat("you lose this round!")
        }
        else {
          cat("It's a draw")
        }
        print(paste("Current Score:", player_score))
      }
    }

    I hope you enjoy!